

Meet our New Trusted Partner: EComposer Landing Page Builder
28 June, 2024
Top 9 Shopify Rewards Programs For 2024
16 July, 2024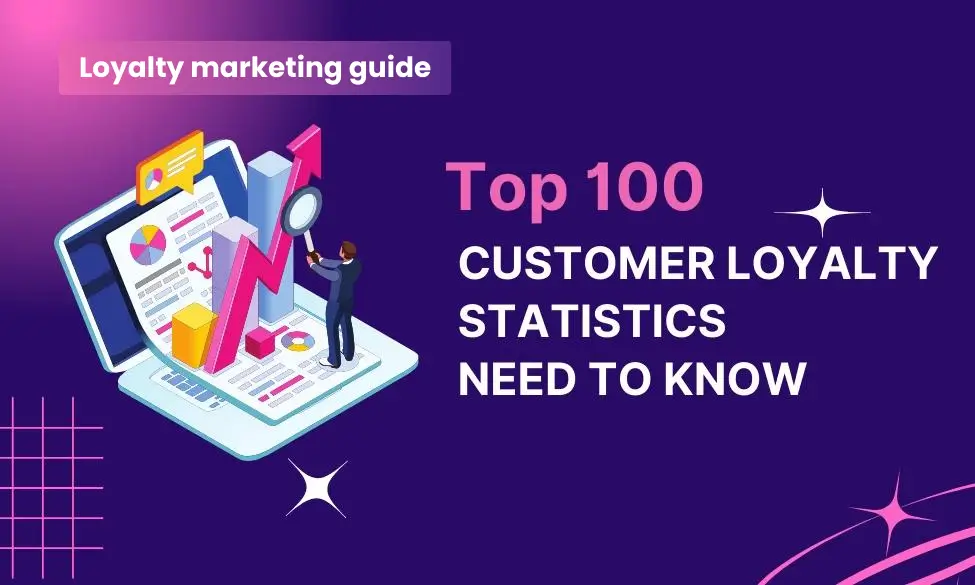
Want to find customer loyalty statistics? You have come to the right place! This blog post provides over 100 customer loyalty statistics in 2024 from reputable statistics sites. We’ll discuss brand loyalty’s causes, from awareness to emotion.
Let’s start!
Customer Loyalty Statistics: The Importance Of Customer Experience In Building Loyalty
Keeping customers coming back is no longer a nice-to-have; it’s a must in today’s market. These numbers make it clear that putting the customer experience (CX) first is the most important part of any successful reward program plan.
1. 1 in 3 businesses without a loyalty program today will establish one by 2027 to shore up first-party data collection and retain high-priority customers. (Gartner’s research).
The Salesforce’s Customer Engagement Research 2022 on customer loyalty statistics:
2. 88% of customers believe trust is more important in times of change (Source: Salesforce’s customer engagement research 2022).
3. 68% of customers trust companies to act with society’s best interest in mind (up from 59% in 2020) (Source: Salesforce’s customer engagement research 2022).
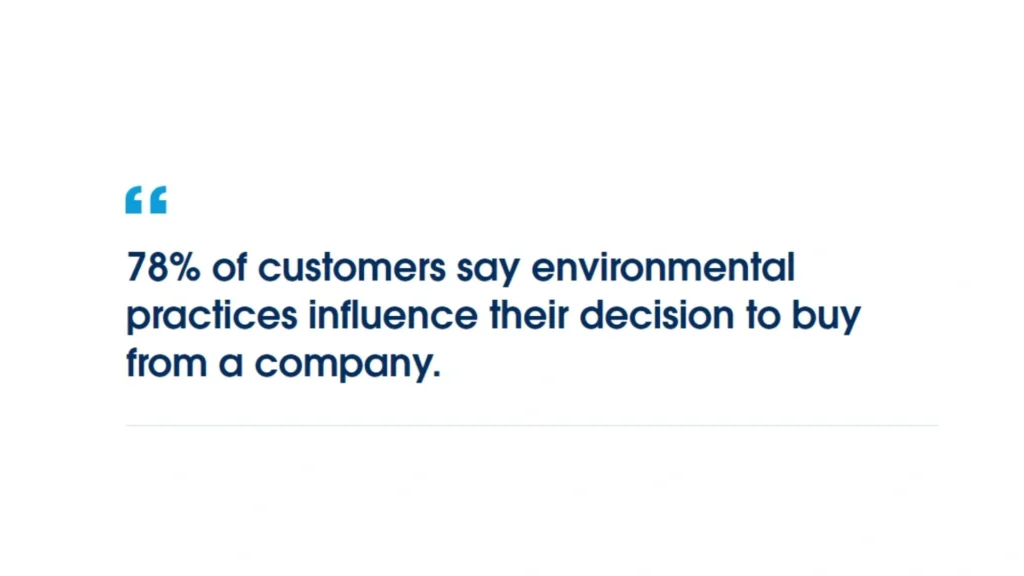
4. 78% of customers say environmental practices influence their buying decisions (Source: Salesforce’s customer engagement research 2022).
5. 66% of customers have stopped buying from companies whose values didn’t align with their own (Source: Salesforce’s customer engagement research 2022).
According to Salesforce’s 2022 customer engagement study, customers want to connect with companies in a way that is smooth, true to their values, and protects their privacy. To build long-term relationships, businesses must focus on what customers want, even if it’s hard.
6. 60% of US consumers who tried different stores, websites, or brands during COVID-19 expect to integrate them into their post-COVID lives. (Source: McKinsey Quarterly Five Fifty).
McKinsey’s last customer loyalty statistics give us an exciting look at how customers behaved after the pandemic. Reward programs that work well across all channels can help keep these new customers and build long-lasting brand loyalty.
Statista’s Statistics: The Importance Of Customer Service And Loyalty Programs In Building Brand Loyalty
Statista’s statistics clearly show that customer service, data security, and loyalty programs are all key ingredients in building brand loyalty.
7. Almost eight out of ten shoppers worldwide thought company trust depended on good customer service. (Source: Statistics’s top consumer loyalty drives worldwide 2023).
8. More than 60% of people in the U.S. said they wouldn’t buy from a company they couldn’t contact. (Source: Statistics’s brand purchase likelihood if customers couldn’t reach U.S. 2022).
9. Nearly 90% of shoppers in the U.S. and UK (2022) preferred brands that protect online data (Source: Statistics’s UK and US ad data ethics attitudes 2022).
10. Seven out of 10 U.S. shoppers in a late 2022 survey considered loyalty programs important for brand connection (Source: Statistics’s Top U.S. brand loyalty drivers 2022).
11. Nearly 80% of American consumers in a 2022 poll stated loyalty programs influenced their continued business with a brand (Source: Statistics impact of reward programs on U.S. consumer purchasing 2022).
12. 80% of respondents joining a brand’s loyalty program purchased more frequently (Source: Statistics top ways loyalty programs affected U.S. consumer behavior 2022).
13. More than half of the people who joined a reward program talked about the brand more often (Source: Statistics top ways loyalty programs affected U.S. consumer behavior 2022).
By prioritizing these factors, companies can create a positive customer experience, encourage repeat business, and turn customers into brand advocates.
Statistics compiled from Statista: The Power Of Rewards And Recognition
The Statistics compiled by Statista explore what motivates U.S. consumers to join loyalty programs, including access to discounts, rewards, and exclusive product offerings. They also acknowledge the emotional connection some consumers feel towards brands through these programs.
14. 6 in 10 US consumers seek discounts in loyalty programs (Source: Statistics: U.S. consumers value loyalty program benefits 2022).
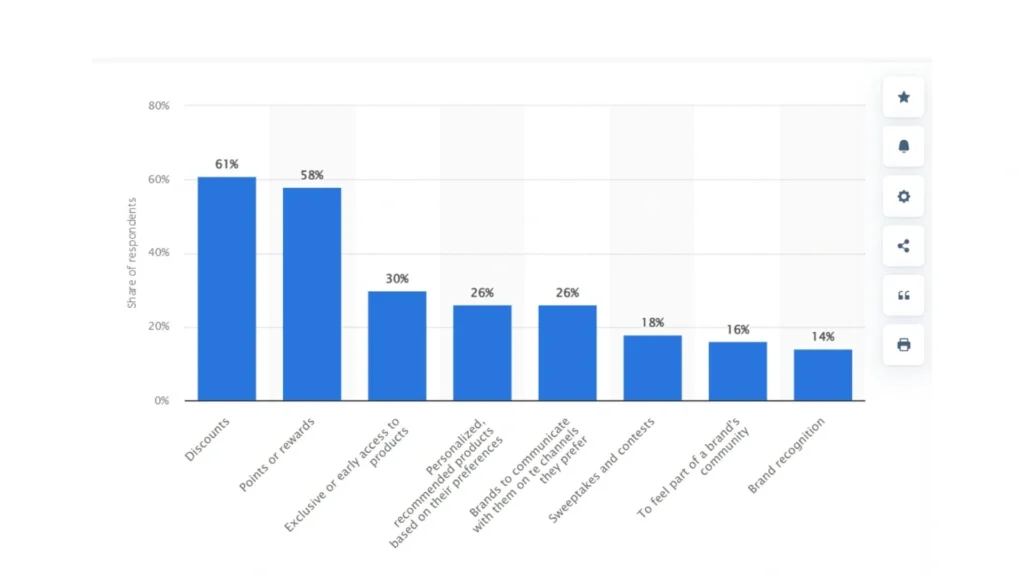
15. Around 1/3 of US consumers value exclusive or early access to products in loyalty programs (Source: Statistics: U.S. consumers value loyalty program benefits 2022).
16. Nearly half of US survey participants joined a program to show brand devotion (Source: Statistics leading brand loyalty indicators in the U.S. 2022).
17. US consumers belong to an average of 16.6 loyalty programs (Source: Statistics: The average US loyalty program membership from 2015 to 2022).
18. US consumers actively use only half of their loyalty programs (Source: Statistics: The average US loyalty program membership from 2015 to 2022).
19. Over 90% of US executives surveyed agree programs need more rewards or benefits (Source: Statistics: US executives’ loyalty program impressions October–November 2022).
20. 79% of US consumers say loyalty programs make them more likely to repurchase (Source: US customers’ propensity to continue doing business with a brand after a loyalty or rewards program in April 2022).
21. Loyalty programs have a slightly higher impact on Gen Z shoppers for repurchases (Source: Top ways loyalty programs affected US customers’ behavior in April 2022).
McKinsey’s Research: Customer Loyalty Statistics Based On Customer Behavior
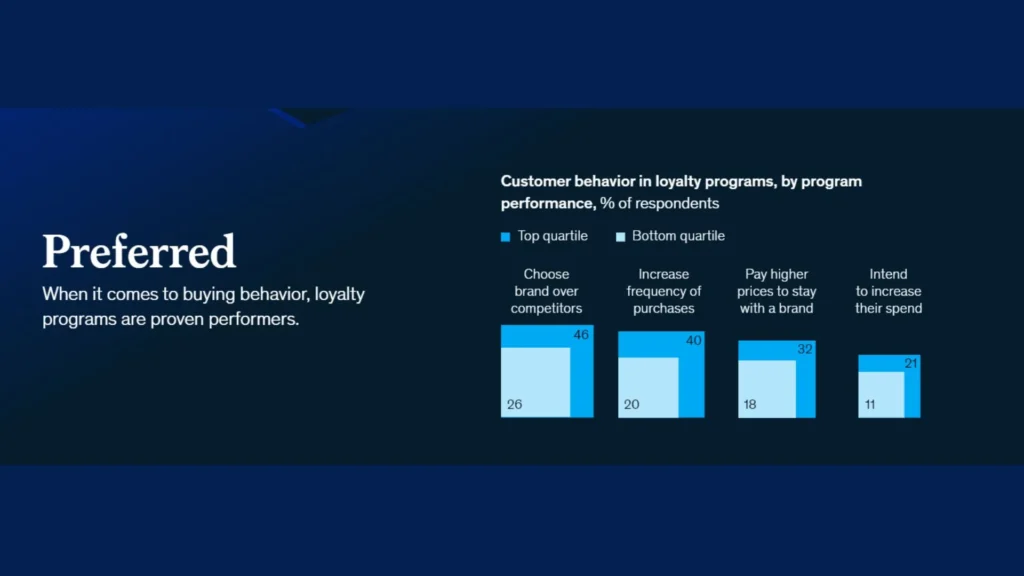
The research of McKinsey highlights a shift in customer behavior in the loyalty program statistics below:
22. 46% of respondents in the top quartile of loyalty programs choose the brand over competitors (Source: McKinsey’s research).
23. 40% of respondents in the top quartile of loyalty programs increase their frequency of purchases (Source: McKinsey’s research).
24. 32% of respondents in the top quartile of loyalty programs pay higher prices to stay with a brand (Source: McKinsey’s research).
25. 21% of respondents in the top quartile of loyalty programs intend to increase their spending (Source: McKinsey’s research).
26. 100% of US consumers have tried different stores, websites, or brands during the COVID-19 crisis (Source: McKinsey’s research).
27. 43% of respondents in paid loyalty programs are more likely to buy weekly since joining (Source: McKinsey’s research).
28. 59% of respondents in paid loyalty programs are more likely to choose the brand over competitors (Source: McKinsey’s research).
29. 62% of respondents in paid loyalty programs are more likely to spend more on the brand (Source: McKinsey’s research).
Due to easier access and lower barriers to entry, consumers are more likely to try new brands. Also, statistics show that programs that work well can improve customers’ behavior, making them like a company more, buy it more often, and spend more.
The idea of “customer loyalty ecosystems” is also looked into in the study. In these, brands work together to make a single pool of data that can be used for more personalized experiences and even more program usage.
McKinsey’s Survey 2022: Customer Loyalty Statistics Impact On Consumer Behavior And Brand Performance Statistics
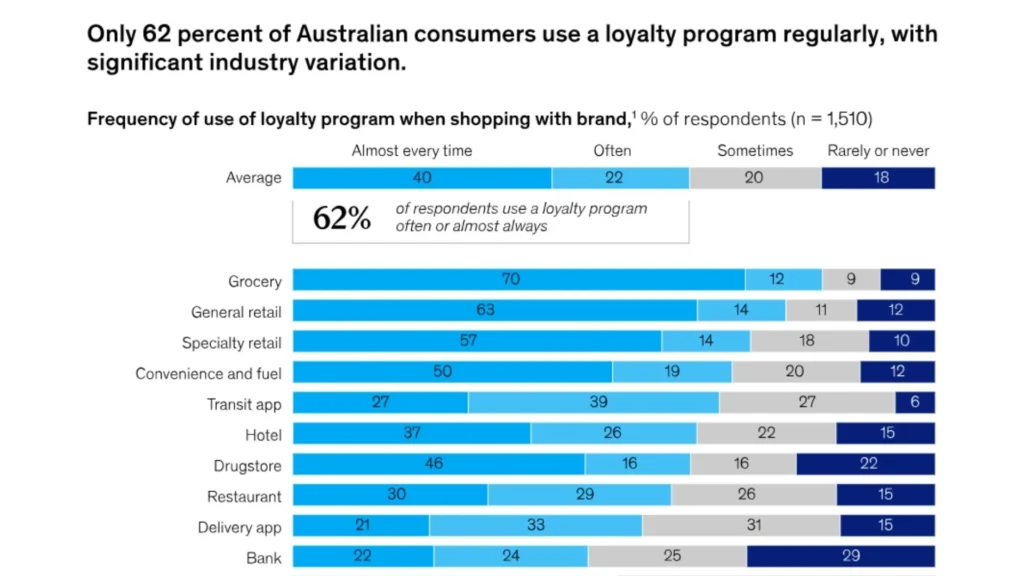
A McKinsey Australia Insight Survey of over 1,400 Australian consumers revealed key insights:
30. 60% of consumers said joining a loyalty program changed their spending behavior in at least one way. It includes increasing buy frequency, choosing the brand over competitors, being more likely to recommend it, or paying more for loyalty points or status. (Source: McKinsey Australia Insight Survey)
31. Top loyalty programs were 10% more likely to bring customers back. 14% more likely to increase by frequency, and 12% more likely to promote the brand than the lowest quartile programs. (Source: McKinsey Australia Insight Survey)
32. 32. Companies with the best reward programs had 44% more customers say they spent more during the COVID-19 pandemic, and those customers stayed with those companies up to four times longer than those with the worst programs (Source: McKinsey Australia Insight Survey)
33. 70% of consumers reported using their grocery loyalty program almost every time they shop. (Source: McKinsey Australia Insight Survey)
34. Almost 50% of consumers reported rarely or never using their airline loyalty program. (Source: McKinsey Australia Insight Survey)
35. 24% of consumers who shop with a brand but don’t participate in the loyalty program stated they were unaware the program existed. (Source: McKinsey Australia Insight Survey).
This survey emphasizes a data-driven, customer-centric approach to loyalty program design, maximizing program effectiveness and customer value.
Deloitte Survey 2022 About Consumer Preferences
The Deloitte Consumer Loyalty Survey 2022 aimed to discover how people’s choices and habits about loyalty programs are changing, especially as the economy and society change. Businesses can use this knowledge to plan and improve their programs so they have the most effect.
36. Year over year, consumers focus on the “ability to earn and redeem financial rewards” and “simplicity and ease” as the two most essential attributes of a loyalty program. (Source: Deloitte Consumer Loyalty Survey).
37. Over half of consumers believe that loyalty programs offer sufficient personalization and that willingness to share personal information is rising. 53% of consumers said they are willing to share their personal information, up markedly from 2021. (Source: Deloitte Consumer Loyalty Survey).
38. More than 55% of consumers are actively seeking credit cards that accelerate their program benefits and rewards, an increase of 12% from 2021 in the latest loyalty survey results. (Source: Deloitte Consumer Loyalty Survey).
39. For customers, the ability to refer a new member and get benefits or awards is still the most important community-related feature. The #2 most important feature is the chance to support causes through a membership program. (Source: Deloitte Consumer Loyalty Survey).
40. More than 35% of consumers state they are willing to pay a membership fee for exclusive benefits and an elevated experience. Of the consumers who pay loyalty membership fees, almost half pay for two or three loyalty programs. (Source: Deloitte Consumer Loyalty Survey).
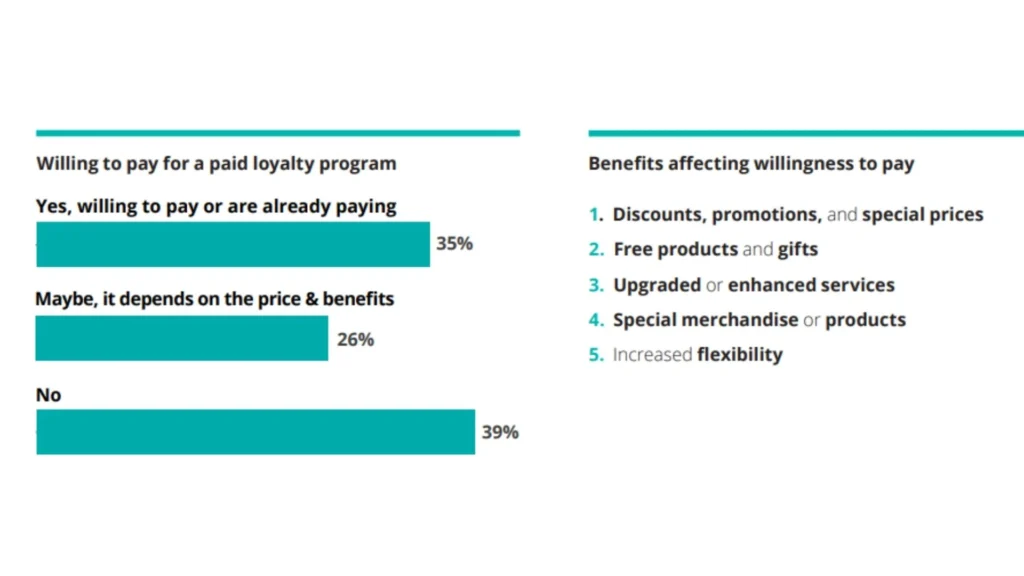
41. Among those willing to pay for a loyalty program, the most desired benefits are discounts, promotions, and special prices (66%). (Source: Deloitte Consumer Loyalty Survey).
While core benefits like simplicity and value remain important, personalization, cause-related initiatives, and paid membership options are all emerging trends with significant potential. Loyalty programs that can adapt to these preferences and create deeper customer connections are likely to be the most successful in the future.
Yotpo Survey 2022: Experience Balance Customer Loyalty
This summary captures the Yotpo Customer Loyalty Survey 2022‘s focus on understanding customer loyalty in a complex economic environment. It highlights the importance of value, personalization, and engaging post-purchase experiences for building customer loyalty.
42. 65.6% of respondents are loyal to brands they love but expect value in return. (Source: Yotpo Customer Loyalty Survey 2022).

43. 35.2% of respondents are loyal despite the cheaper options available. (Source: Yotpo Customer Loyalty Survey 2022).
44. During the first purchase, price is a major influence (20.7%). (Source: Yotpo Customer Loyalty Survey 2022).
45. Sales and discounts are a significant driver (28.1%). (Source: Yotpo Customer Loyalty Survey 2022).
46. Effective customer service also plays a role (22.2%). (Source: Yotpo Customer Loyalty Survey 2022).
47. Joining a loyalty program is the most common action taken by a brand to which customers are loyal (43.5%). (Source: Yotpo Customer Loyalty Survey 2022).
48. Loyalty programs influence purchase decisions for over 83% of shoppers. (Source: Yotpo Customer Loyalty Survey 2022).
49. Feeling like a brand knows them influences repeat purchases (82.5%). (Source: Yotpo Customer Loyalty Survey 2022).
50. Examples of personalization customers appreciate include product recommendations based on past purchases, back-in-stock alerts, and using customer names in communication. (Source: Yotpo Customer Loyalty Survey 2022).
51. Over 40% of customers would stop being loyal due to irrelevant or spammy messages. (Source: Yotpo Customer Loyalty Survey 2022).
52. Not receiving loyalty points for purchases is a major negative factor (45.4%). (Source: Yotpo Customer Loyalty Survey 2022).
53. Irrelevant communication and lack of information about orders are negative experiences. (Source: Yotpo Customer Loyalty Survey 2022).
54. A bad post-purchase experience can lead to customers telling friends (51%), unsubscribing from communications (40%), and writing negative reviews (33.8%). (Source: Yotpo Customer Loyalty Survey 2022).
PWC’s Survey 2022: Balance Value, Personalization, and Engagement In Loyalty Program
The goal of PwC’s Customer Loyalty Executive Survey 2022 was to discover how customer behavior and expectations about loyalty have changed because of the pandemic, economic uncertainty, and changing technology settings. Over 4,000 US shoppers took part in this poll.
55. 87% of respondents named at least one aspect of personalization that’s important to them. 82% are willing to share some personal data for a more personalized experience (Source: PwC Customer Loyalty Survey 2022).
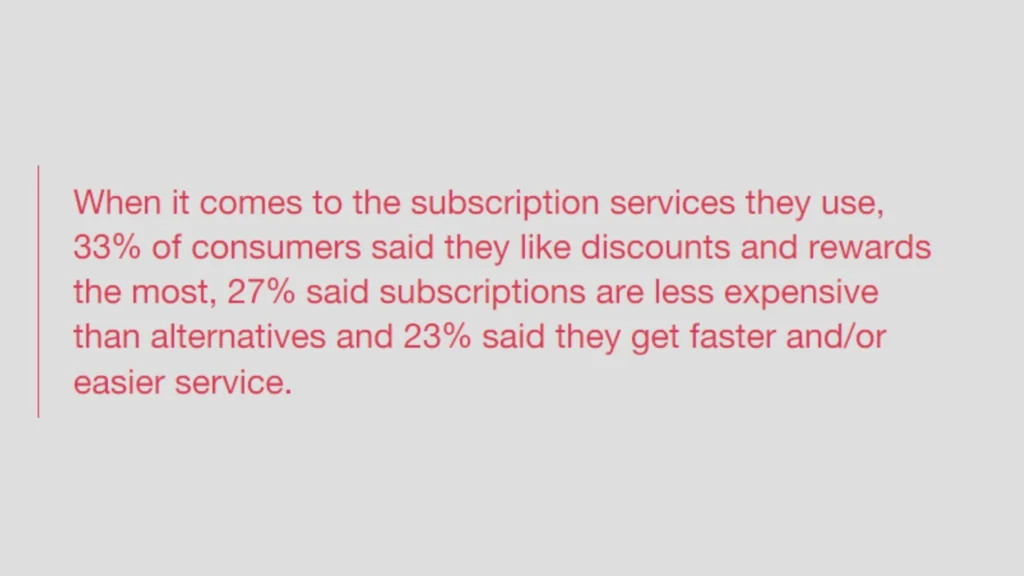
56. Discounts and rewards are the most valued benefits (33%), followed by lower prices (27%) and faster/easier service (23%) (Source: PwC Customer Loyalty Survey 2022).
57. 53% of customers said the reason they keep using a business is that they get good value for the rewards (Source: PwC Customer Loyalty Survey 2022).
PwC’s 2022 Customer Loyalty Executive Survey emphasizes the need for businesses to adapt to a rapidly changing consumer environment.
PWC’s Survey 2023: Consumer Behavior And Business Investment
The PwC Customer Loyalty Statistics 2023 aimed to understand how businesses approach customer loyalty strategies in a challenging economic climate.
PwC surveyed over 400 executives to gain insights into their perspectives on customer retention and loyalty programs. This survey builds upon a previous consumer survey conducted in May 2022.
58. 61% of executives believe customers are more loyal, with higher percentages in specific industries (Media & Entertainment – 79%, Technology – 75%, Consumer Products – 69%) (Source: PwC Customer Loyalty Executive Survey 2023).
59. 48% of customers believe product/service quality drives loyalty (46%). (Source: PwC Customer Loyalty Survey 2023).
60. Over 60% of executives increased loyalty program budgets in their recent planning cycle. (Source: PwC Customer Loyalty Executive Survey 2023).
Also, PwC Holiday Outlook 2023 asks 4,000 people to guess how much they plan to spend, when and where they will travel and shop, and how much they plan to spend:
61. 58% of travelers will use rewards to book travel during the holidays. (Source: PwC Holiday Outlook 2023).
62. 63% of consumers consider a loyalty program valuable. (Source: PwC Holiday Outlook 2023).
63. 71% of Emtechies (tech-savvy consumers) belong to a loyalty program. (Source: PwC Holiday Outlook 2023).
64. 53% of consumers belong to a loyalty program. (Source: PwC Holiday Outlook 2023).
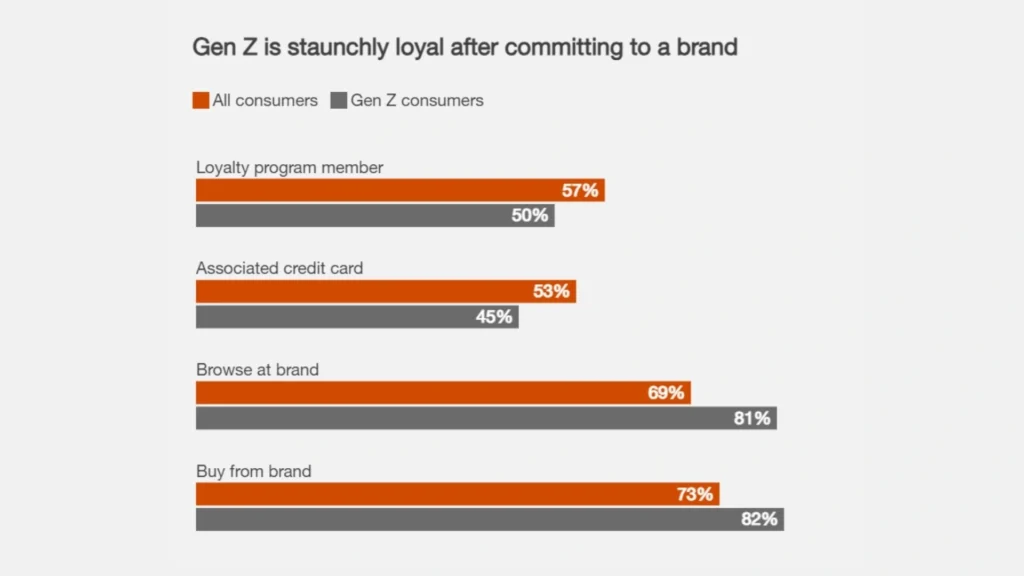
65. 82% of tech-savvy consumers browse their preferred brand’s website due to a loyalty program. (Source: PwC Holiday Outlook 2023).
66. 81% of Gen Z browse their preferred brand’s website. (Source: PwC Holiday Outlook 2023).
67. 82% of Gen Z buy from their preferred brand due to a loyalty program. (Source: PwC Holiday Outlook 2023).
68. 73% of consumers buy from their preferred brand. (Source: PwC Holiday Outlook 2023).
69. Men are more brand-loyal than women (67% vs. 59%). (Source: PwC Holiday Outlook 2023).
70. Millennials are more likely to belong to a loyalty program than Gen Z (62% vs. 50%). (Source: PwC Holiday Outlook 2023).
This research suggests that companies need to move beyond a purely transactional focus and develop strategies that foster deeper customer relationships throughout the entire customer journey.
Benchmark Survey 2023: Challenges And Trends
This 2023 Customer Loyalty and Personalization Benchmark survey, conducted by Retail TouchPoints in collaboration with Mastercard, examines customer loyalty trends and explores the challenges and opportunities retailers face.
71. 43% of retailers identified out-of-stock products due to supply chain disruptions that hurt customer loyalty (Source: 2023 Customer Loyalty and Personalization Benchmark Survey).
72. 38% of retailers said poor data management and lack of customer insights hinder effective loyalty programs (Source: 2023 Customer Loyalty and Personalization Benchmark Survey).
73. 27% of retailers adopting AI solutions in customer loyalty programs are on the rise (Source: 2023 Customer Loyalty and Personalization Benchmark Survey).
74. Many retailers are highlighting their ESG efforts (environmental, social, and governance) to attract customers (53% for recycled products and 52% for environmental sustainability) (Source: 2023 Customer Loyalty and Personalization Benchmark Survey).
75. Traditional points-based programs might lose effectiveness (fewer retailers with high loyalty program membership) (Source: 2023 Customer Loyalty and Personalization Benchmark Survey).
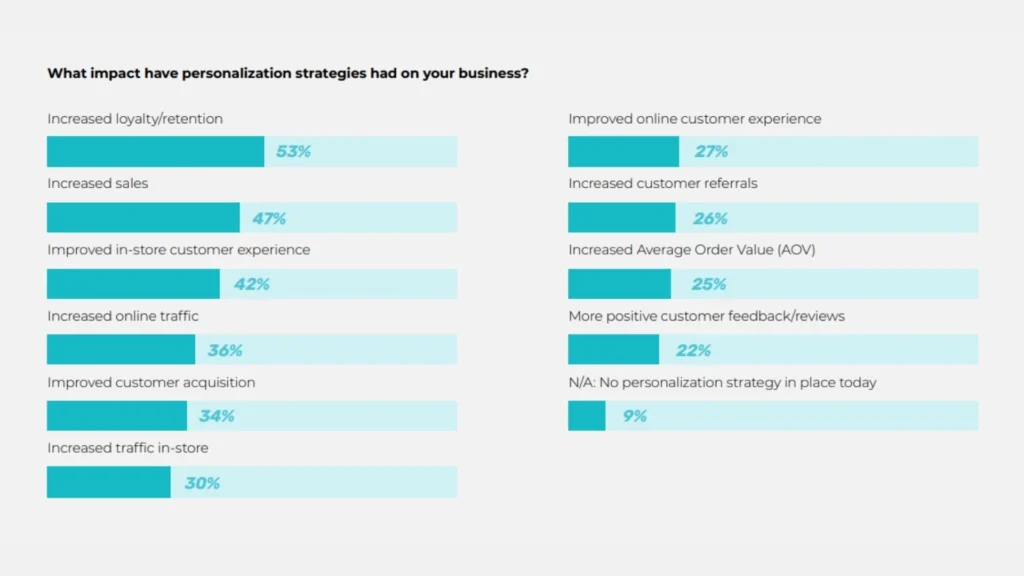
76. 53% of retailers said personalization benefits increased customer loyalty/retention (decreased from 69% in 2022) (Source: 2023 Customer Loyalty and Personalization Benchmark Survey).
The retail loyalty landscape is undergoing a significant shift. Traditional loyalty programs are becoming less effective, and personalization efforts face challenges. Retailers need to adapt to these changes by leveraging new technologies, focusing on data privacy, and personalizing the customer experience across all touchpoints.
Euromonitor’s Survey 2023 About Experience-Driven Consumers
The Voice of the Consumer: Customer Loyalty Statistics Digital Survey 2023 likely provides insights into how new technologies change consumer behavior and expectations throughout the online shopping journey.
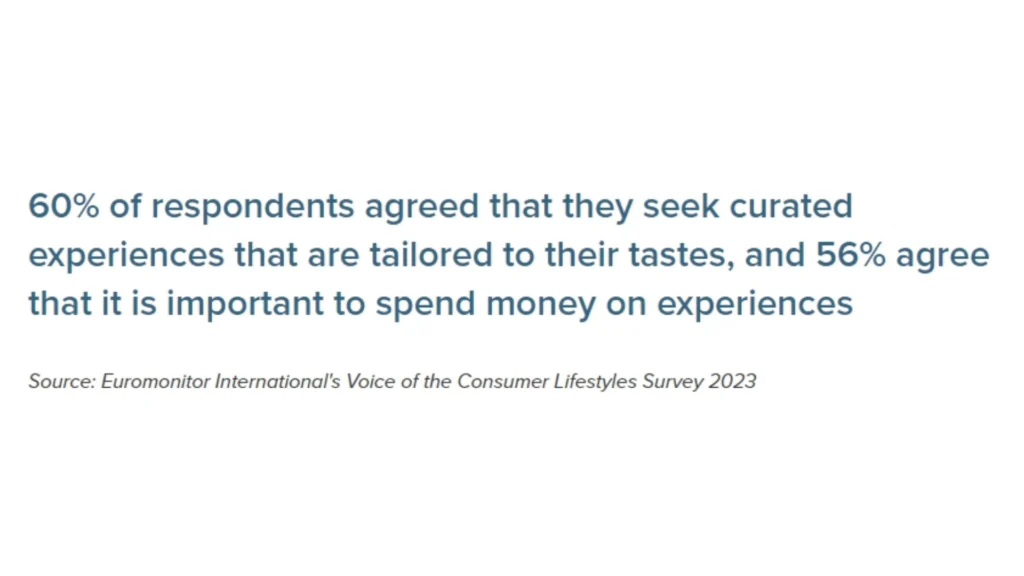
77. 60% of respondents agreed that they seek curated experiences tailored to their tastes (Source: Euromonitor’s Survey).
78. 56% of respondents agree that it is important to spend money on experiences (Source: Euromonitor’s Survey).
79. More than 79% of Generation Z will access Instagram and TikTok multiple times daily in 2023 (Source: Euromonitor’s Survey).
80. 25% of consumers are profiled as “Engaged Loyalist” by Euromonitor International (Source: Euromonitor’s Survey).
81. More than 33% of respondents are interested in interacting with others in an immersive virtual world instead of in-person in 2022 (Source: Euromonitor’s Survey).
KPMG’s Research 2024 About Customer Engagement And Advocacy
KPMG’s The Evolution of Loyalty Programs 2024 study focused on the hotel and lodging industry, specifically investigating the evolving role of loyalty programs in a post-pandemic environment. The study aimed to determine how well reward programs work in this area to attract new customers, keep old ones, and engage them.
82. 88% of satisfied premium loyalty program members prefer that business over a competitor offering a lower price. (Source: KPMG consumer survey data and analysis).
83. 83% of satisfied premium loyalty program members say joining a loyalty program will lead them to continue purchasing from that business. (Source: KPMG consumer survey data and analysis).
84. 70% of satisfied premium loyalty program members recommend brands to others if they believe their loyalty programs add value. (Source: KPMG consumer survey data and analysis).
85. 66% of satisfied premium loyalty program members modify spending to maximize loyalty benefits. (Source: KPMG consumer survey data and analysis).
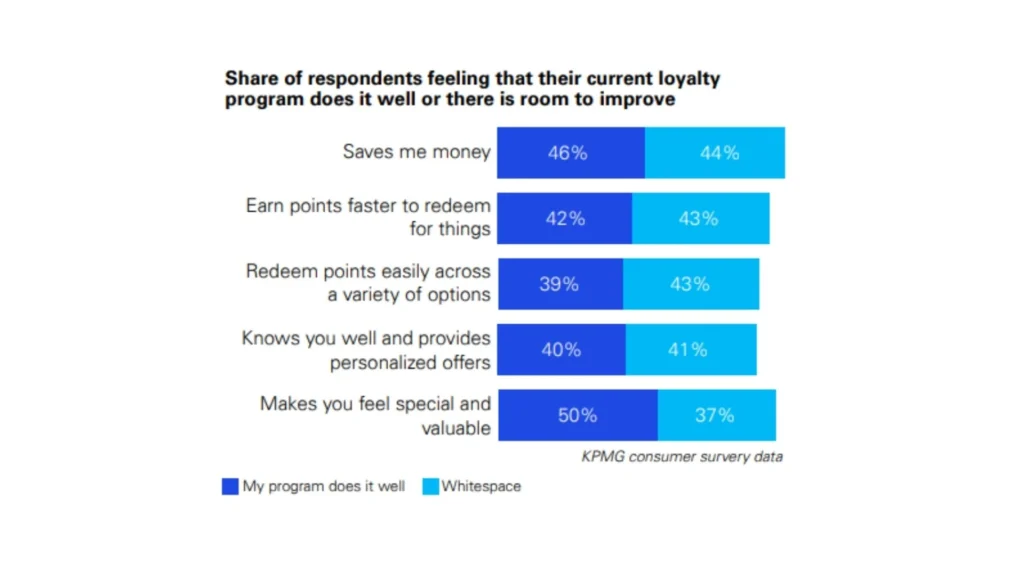
86. 46% of respondents feel their loyalty program saves them money. (Source: KPMG consumer survey data).
87. 42% of respondents feel their current loyalty program allows them to earn points faster to redeem for things. (Source: KPMG consumer survey data).
88. 39% of respondents feel their current loyalty program makes redeeming points across various options easy. (Source: KPMG consumer survey data).
89. 40% of respondents feel their current loyalty program knows them well and provides personalized offers. (Source: KPMG consumer survey data).
90. 50% of respondents feel their current loyalty program makes them feel special and valuable. (Source: KPMG consumer survey data).
This KPMG study underscores the enduring value of loyalty programs in the travel and lodging industry. However, to remain effective in this evolving landscape, programs need to adapt to meet changing customer preferences and industry challenges.
Deloitte Digital’s Research 2024: Personalization In Customer Loyalty
Deloitte Digital’s personalization research in 2024 aimed to understand the effectiveness of personalization in building customer loyalty.
91. Personalization leaders outperform low-maturity brands across all stages of the customer journey. This includes higher conversion rates, customer satisfaction, average order value, and lifetime value (Source: Deloitte Digital’s personalization research)
- Conversion rate: 38% vs. 54% for personalization leaders vs. low-maturity brands
- Lifetime value: 29% vs. 57% for personalization leaders vs. low-maturity brands
- Customer satisfaction: 37% vs. 61% for personalization leaders vs. low-maturity brands
- Customer engagement: 44% vs. 61% for personalization leaders vs. low-maturity brands.
92. 78% of consumers said personalized offers for discounts or special bundles significantly influenced their purchase decisions (Source: Deloitte Digital’s personalization research).
93. Surveyed consumers placed “personalized insights that save money” at #1 on the list of the most meaningful forms of personalization. (Source: Deloitte Digital’s personalization research)
94. 67% of consumers said they spend more money when personalization reflects an understanding of them and anticipates their needs (Source: Deloitte Digital’s personalization research)
95. Nearly 3 in 4 consumers are more likely to purchase from brands that deliver personalized experiences and spend 37% more with those brands (Source: Deloitte Digital’s personalization research).
Science of Loyalty Research 2024 About Building Customer Relationships
The Science of Loyalty research aimed to understand the drivers behind consumer loyalty and provide actionable insights for marketers.
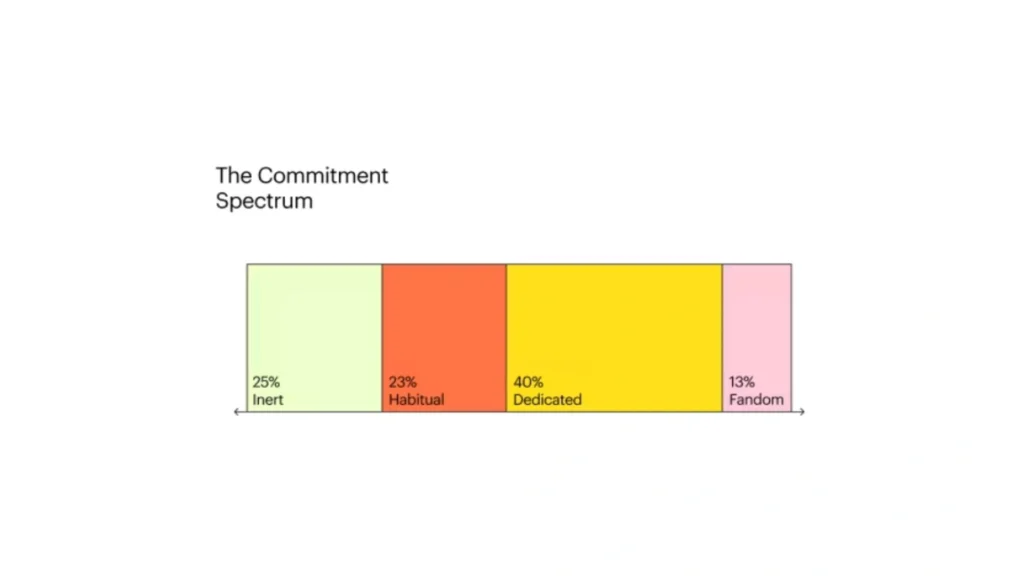
96. The report identifies a spectrum of loyalty ranging from “inert” to “fandom.” Only 13% of respondents belonged to the “fandom” loyalty group (Source: Science of Loyalty research).
97. Almost half (46%) of repeat purchasers said they know a lot about the brands they purchase from. This rises to 60% among “Fandom” purchasers (Source: Science of Loyalty research).
98. About half (49%) of repeat purchasers said that recommendations from friends or family help them decide what to buy, rising to 72% among 18-24-year-olds (Source: Science of Loyalty research).
99. Only 52% of inert customers and 51% of chronic had a favorable opinion of their preferred brand, which rises to 84% among “fandom” purchasers (Source: Science of Loyalty research).
100. 35% of those who purchase daily or weekly said their preferred brand was the only one they’d consider vs 22% among those purchasing monthly or less (Source: Science of Loyalty research).
101. 97% of repeat purchasers said their preferred brand makes it quick and easy to purchase (Source: Science of Loyalty research).
102. 47% of all email subscribers explore new product offerings through brand emails, and 39% purchase the message after reading the message (Source: Science of Loyalty research).
103. Less than half (37%) of customers have recommended their preferred brand to friends or family, and only 22% have given it as a gift (Source: Science of Loyalty research).
104. The most popular method of contact is email, with over half (57%) of shoppers looking to keep in touch with brands this way (Source: Science of Loyalty research).
105. Only 16% have joined a loyalty benefits program, suggesting untapped potential (Source: Science of Loyalty research).
106. 26% of consumers said they would consider switching brands due to environmental impact or unethical manufacturing, rising to 34% among 18-24 year old shoppers (Source: Science of Loyalty research).
107. While 45% of repeat purchasers said they’d like deals or discounts, 87% said their preferred brand made them feel good, the second most significant driver of loyalty after consistency (Source: Science of Loyalty research).
While “fandom” loyalty is the ideal, it’s not achievable for all brands. A good strategy should target different levels of the commitment spectrum.
Key Takeaway
There’s no doubt about it: in 2024, customer trust is key to running a successful business. You can turn people who have only bought from you once into brand fans by figuring out why they do what they do and implementing innovative reward programs.
Remember that keeping customers is a process, not a goal. Check our blog often for the most customer loyalty statistics and industry trends.
Lindsey Nguyen is a Content Marketing Specialist at BON Loyalty, specializing in digital marketing and eCommerce. At BON Loyalty, she crafts content that empowers Shopify store owners to build and sustain thriving customer relationships through innovative loyalty programs. Her articles, often featured on the BON Loyalty blog, provide valuable strategies and insights that help businesses enhance customer loyalty and increase customer lifetime value.

