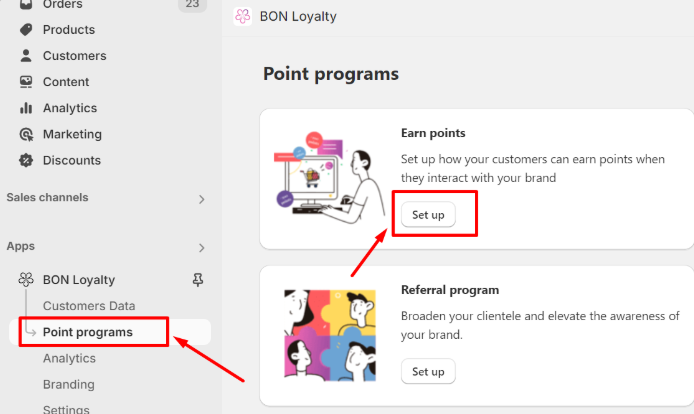
To manage the actions you set up for your customers to earn points, kindly navigate to BON Loyalty > Point programs > Earn points. You will find all available point-earning actions we offer you there.
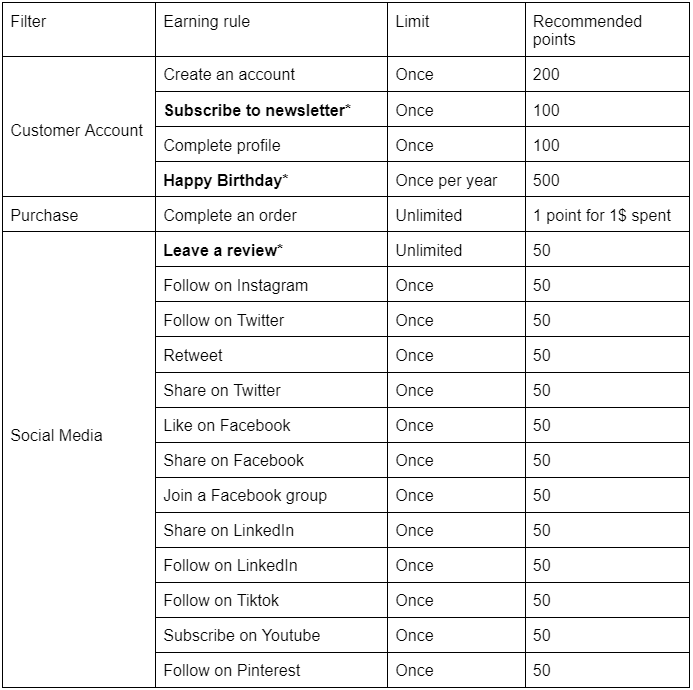
BON Pro Tip: This table below contains all available point-earning options in BON, including the earning limit and the recommended point amount reward for each option.
Note: Three point-earning actions written in bold * are available from the Basic plan or higher.
For more information, check out our pricing plans on our website.
How to activate, deactivate, and edit point-earning
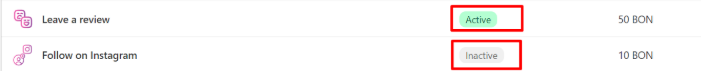
All the earning-point options are divided into 2 sections:
Active: All the actions your customers can earn points for, and are visible on your widget/ loyalty page
Inactive:All the actions your customers cannot earn points for, and will be hidden on your widget/ loyalty page
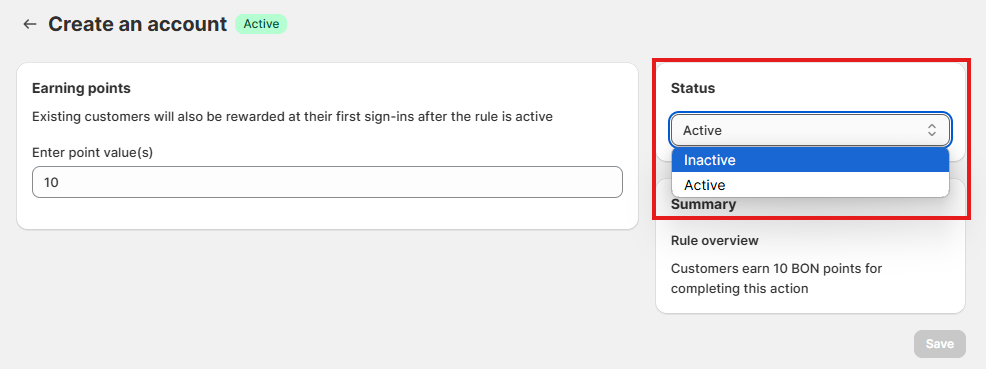
To activate or deactivate an action, hover your mouse over the desired action > Click on it to navigate to its settings > Select either Active or Inactive from the Status dropdown menu > Save
How customers see the point-earning actions
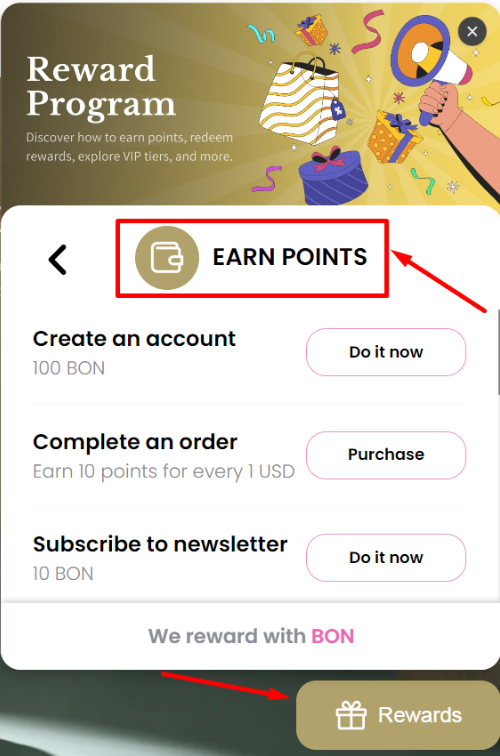
Through the Widget: Open the Widget > Click on the Earn points tab > Customers will see all “Active” point-earning actions
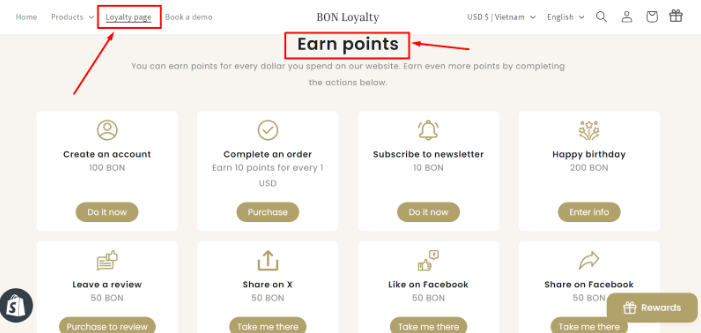
Through the Loyalty page: Open the Loyalty page > Scroll down to Earn points block > Customers will see all “Active” point-earning actions